 |
| |
World Ocean Circulation Experiment
Program Information
|
BACKGROUND
The concept of a World Ocean Circulation Experiment (WOCE) originated in the late 1970s following the first successful use of satellite altimeters to monitor the ocean's sea surface topography (National Academy of Sciences, 1983). WOCE was incorporated into the World Climate Research Programme (WCRP) as a means of providing the oceanic data necessary to test and improve models of the global climate (Thompson, Crease and Gould, 2001). The initial meetings to define WOCE were held in the early 1980s and, with planning complete, culminated in a meeting at UNESCO Headquarters in Paris, France, in December 1988 (UNESCO, 1989). During this meeting representatives of many countries agreed to take part in the programme and pledged to carry out elements of the internationally agreed Implementation Plan (WCRP, 1988a, b). The hydrographic component, designed to obtain a suite of measurements throughout the global ocean, was the largest single part of the in situ programme. This atlas is the first in a series of four that will present the results of the WOCE Hydrographic Programme (WHP). It focuses on the Southern Ocean and consists of a series of vertical sections of the scalar parameters measured during a selection of the WOCE One-Time hydrographic cruises, together with a series of horizontal maps showing the geographical distribution of properties. These maps incorporate not only WOCE one-time data, but also high-quality non-WOCE observations and data from the WOCE repeat hydrography programme. Finally, property-property plots of the parameters are presented for each section. |
WOCE AND ITS OBSERVATIONS
The Hydrographic Programme was one part of the global sampling effort within WOCE, which also included satellite observations of the ocean surface, measurements of ocean currents using surface drifters, subsurface floats, current meter moorings, acoustic Doppler current profilers, measurements of sea level using tide gauges, repeated surveys for temperature using expendable bathythermographs, and surface meteorology measurements (see Siedler, Church and Gould 2001). WOCE also supported major modelling projects, including general circulation models of both the ocean alone and of the ocean coupled with the atmosphere, and ocean data assimilation activities. It had links to many other programmes such as the Joint Global Ocean Flux Study (JGOFS) (Wallace, 2001) and the Tropical Ocean and Global Atmosphere (TOGA) Observing System (Godfrey et al., 2001). The WOCE field programme took approximately ten years to complete, but most observations were carried out between 1990 and 1998. The synthesis and modelling components of WOCE and the wider scientific exploitation of WOCE results will continue for many years. The main aim of the WOCE observations was to acquire a high quality data set, which in some sense represented the "state of the oceans" during the 1990s. These data are being, and will continue to be, used to improve models of the ocean-atmosphere coupled system with the aim of improving our ability to forecast changes in ocean climate. They also provide a 1990s baseline against which to assess future (and past) changes in the ocean. |
The WOCE Hydrographic Programme
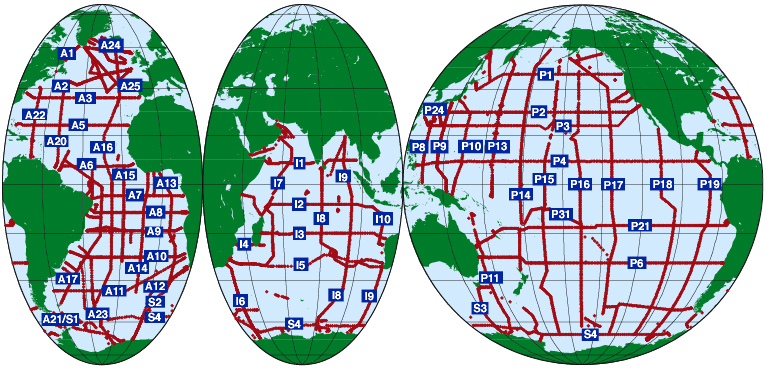
Three types of hydrographic survey were used. The first, known as the One-Time Survey, involved sampling coast-to-coast across all the main ocean basins. Each observation site or "station" measured properties from the surface to within a few metres of the sea floor. Stations were typically 30 nautical miles (~55 km) apart, with the station spacing chosen to help document the oceanic mesoscale variability with its typical scale of 100-200 km. Closer station spacing was used over steep seabed topography, on meridional sections through the tropics where narrow zonal currents were important and when crossing major current systems (see King, Firing and Joyce, 2001). The global network of WOCE Hydrographic Programme (WHP) one-time stations is shown in Figure 1. While the scientific justification for individual lines was to improve our knowledge of specific features of the ocean circulation (e.g. flow through gaps or "choke points"), the main aim of the One-Time Survey was to obtain a fairly uniform grid of stations in each ocean basin (WCRP, 1988a, b). The second part of the hydrographic survey was the Repeat Hydrography (see Figure 2). Here, multiple transects were made along the same cruise track at various time intervals, usually sampling for a reduced suite of parameters. Frequently these included only temperature, salinity, and dissolved oxygen. Some of the repeat lines coincided with lines in the One-Time Survey. Sampling was not always to the bottom on these cruises, which were generally made where the variability was particularly important and where such highly intensive surveys could be carried out practicably. Data from six of these cruises are included in the Southern Ocean sections and all are used in the horizontal maps. |
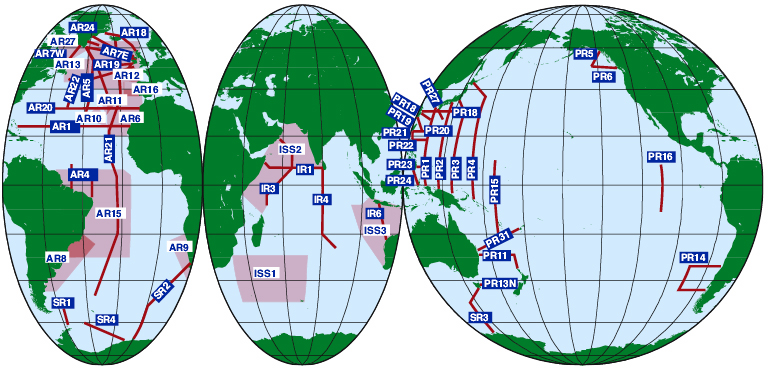
The shaded regions are Intensive Study Areas
|
The third portion of the survey was a series of individual stations that were sampled at approximately
monthly intervals over periods of several years. These are generally referred to as Time Series stations.
The original plan was to complete the survey of each ocean within a one to two year period. For various logistical and resource reasons this was not achieved, and the cruises within each ocean span several years (see Table 1). However, we believe that the data provide as near synoptic a view of the state of the ocean during the 1990s as was possible, and that the inconsistencies introduced by non-synoptic sampling are relatively minor. The WHP data also fill many gaps in the Southern Ocean as well as providing, for the first time, comprehensive global coverage of many parameters (e.g., chlorofluorocarbons (CFCs), helium, tritium and Carbon-14) first measured during the GEOSECS Expeditions during the 1970s (Bainbridge et al., 1981). The sampling techniques used during the WOCE One-Time cruises have been developed and tested rigorously over many years (WHPO, 1991). Each station consisted of a surface to near-bottom lowering of a conductivity, temperature, depth (CTD) probe that also measured in situ pressure. Most of these were also equipped with continuous-sampling dissolved oxygen (O2) sensors. These data were transmitted up the conducting cable and logged on board the ship. Discrete samples of water were collected at depths selected throughout the water column to resolve the vertical structure. These discrete samples were used for chemical analysis and for quality control of the continuously sampled salinity (derived from temperature, conductivity and pressure) and oxygen data. |
Rosette samplers used in WOCE were of the type developed during the GEOSECS programme, and generally were able to take either 24 or 36 10-litre samples during each cast. This sampling
scheme supplied enough water so that all samples could be drawn from one rosette bottle. (On WOCE cruises prior to 1993, before accelerator
mass spectrometry became available as a measurement tool, a separate large-volume cast was required for the Carbon-14 samples.) Note that
not all parameters were sampled at all depths or all stations.
Several calibration cruises were carried out as part of the run-up to the WHP:
A complete list of all WOCE cruises shown as vertical sections in the Southern Ocean Atlas is given in Table 1 . Fourteen meridional sections were selected to depict the full evolution of Southern Ocean waters around Antarctica and the exchanges with the three ocean basins to the north. A zonal circumpolar section is also included to portray the influence of property fluxes between the Antarctic Circumpolar Current and subpolar circulations to the south and the subtropical circulations to the north. The cruise list includes details of the dates of occupation for each section (from which the departure from synopticity can be assessed), the parameters sampled and the investigators and institutions responsible for the analysis. |
WHP oversight
Throughout the programme, the international community provided oversight through the WOCE Hydrographic Programme Planning Committee. This committee, chaired at various times by Drs. Terrence Joyce (Woods Hole, USA), Jens Meincke (University of Hamburg, Germany), Peter Saunders (Institute of Oceanographic Sciences, U.K.), James Swift (Scripps Institution of Oceanography, USA), and Piers Chapman (Texas A&M University, USA), was charged with ensuring that data were collected and processed according to agreed specifications. A Data Analysis Centre, initially at Woods Hole (headed by T. Joyce) and later at Scripps (under J. Swift), collated all the individual data sets arising from each cruise and arranged for the quality control procedures necessary to ensure the required high quality. The WHP Special Analysis Centre (WHP-SAC) in Hamburg, Germany, helped to collate the WHP data set in association with the WOCE Hydrographic Programme Office (WHPO). All WOCE data used in this atlas were obtained from the WHPO. The full WHP data sets obtained on all cruises are available on a DVD set issued by the WOCE International Project Office (http:/www.woce.org) and the U.S. National Ocean Data Center (http:/www.nodc.noaa.gov/woce_v3/). |
 |
 |
 |
 |
|